|
W. 1. Synthesis and characterisation of EDOT-HPβCD and Py-HPαCD inclusion complexes
For this purpose, equimolar amounts of EDOT and cyclodextrins, or Pyrrole and HPαCD were mixed in water solutions. The ICs were obtained as white powders by lyophilisation. The chemical structures of the ICs were proved by 1H NMR, 2D NMR, FTIR, SEM microscopy, thermal analysis and molecular docking.
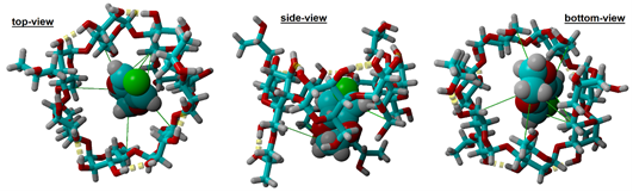
The molecular docking indicated the presence of seven contacts (green line) with an average length of 4.43±0.38 Å, correlated with the hydrophobic contacts between the receptor (HPβCD) and the ligand (EDOT).
|
Fig. 1. The molecular docking of 1:1 EDOT (guest) and HPβCD (host) molecule IC. |
|
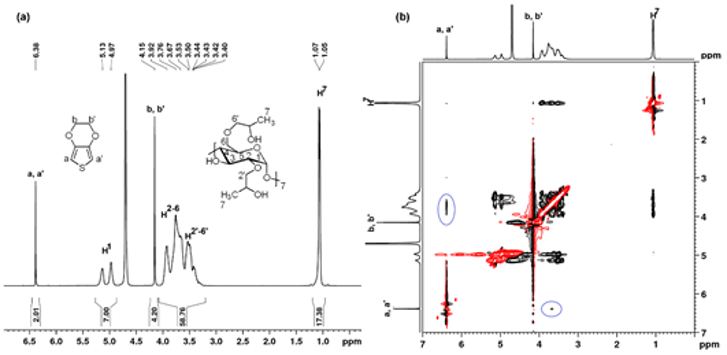
Fig. 2. The 1H-NMR (a) and HH-ROESY NMR (b) in D2O of the EDOT-HPβCD IC. |
|
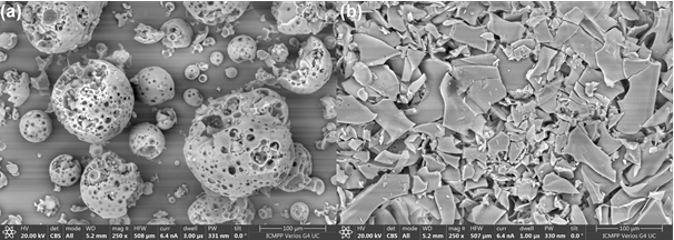
Fig. 3. SEM images of the HPβCD (a) and EDOT-HPβCD IC (b) |
|
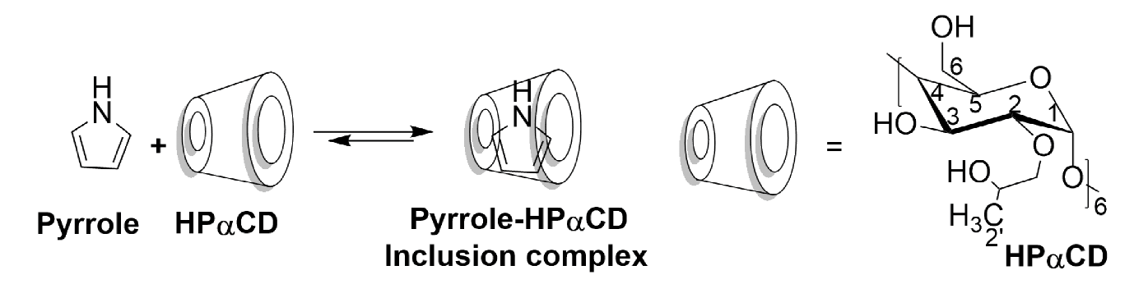
Fig. 4. Schematic representation of the synthesis of Py-HPαCD inclusion complex. |
|
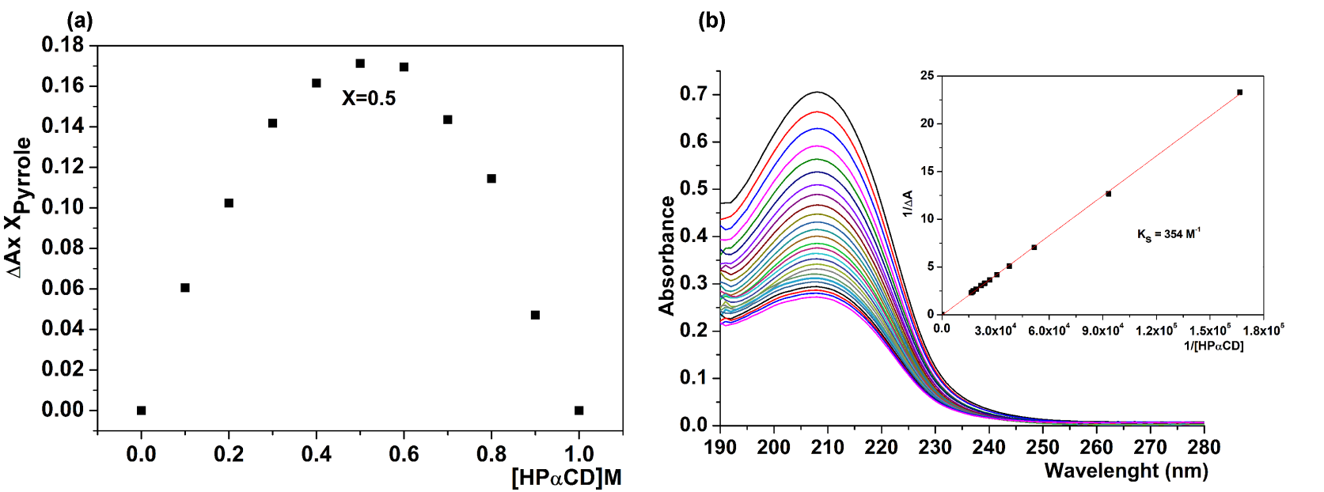
Fig. 5. The Job’s plot (a) and measurement of the stability constant by the Benesi-Hildebrand method (b) of the Py-HPαCD inclusion complex. |
W.2. Synthesis of PEDOT/HPβCD polyrotaxanes architectures.
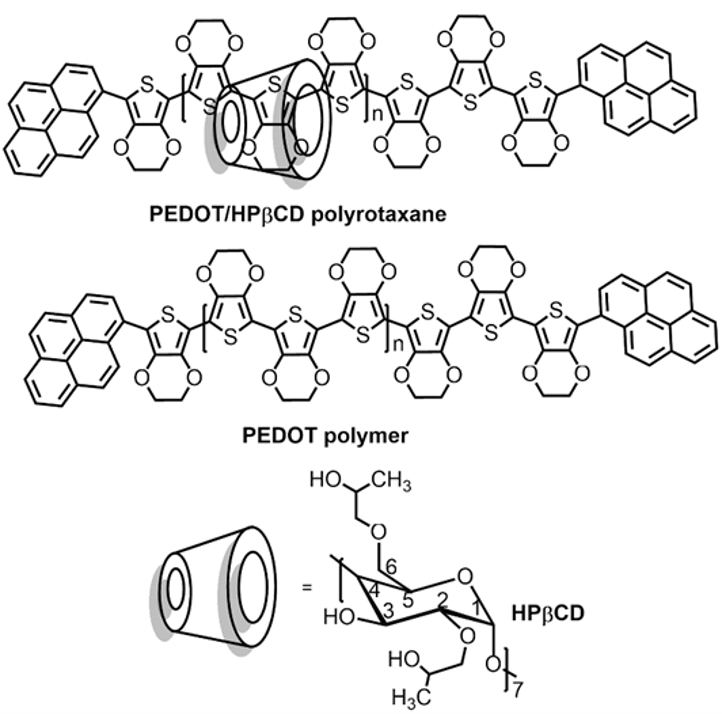
The oxidative polymerization of EDOT-HPβCD IC in water, using FeCl3 results in the formation of a pseudopolyrotaxane structure. Then, by blocking the end-chains of PEDOT with pyrene, the subsequent polyrotaxane is obtain.
|
Fig. 6. The chemical structures of the PEDOT/HPβCD polyrotaxane and PEDOT polymer. |
|
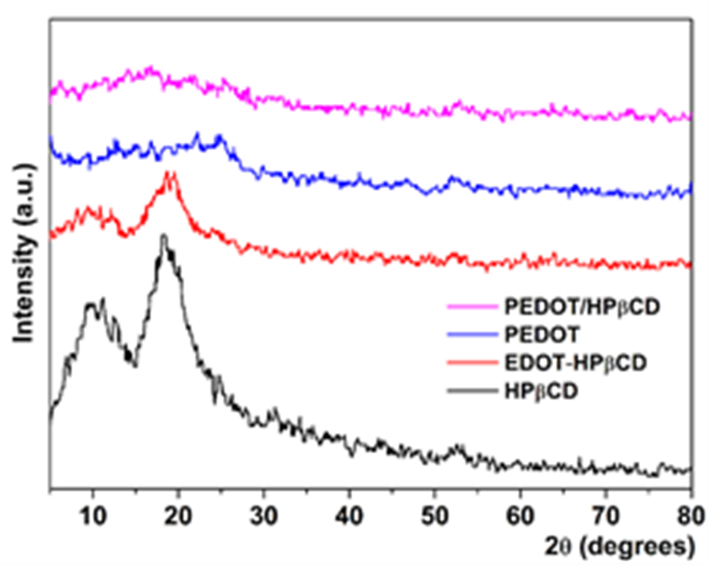
Fig. 7. WAXS patterns of HPβCD, EDOT-HPβCD IC, PEDOT and PEDOT/HPβCD polyrotaxane. |
|
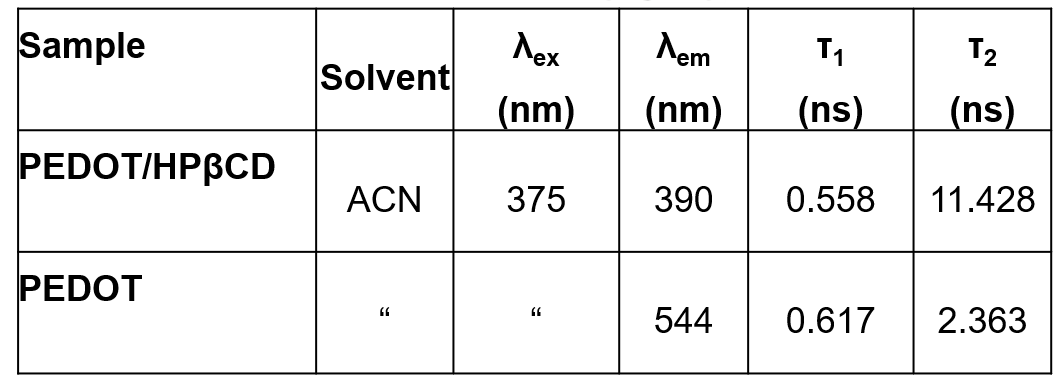
Table. 2. Emission lifetimes (τ) of PEDOT/HPβCD polyrotaxane and PEDOT.
|
|
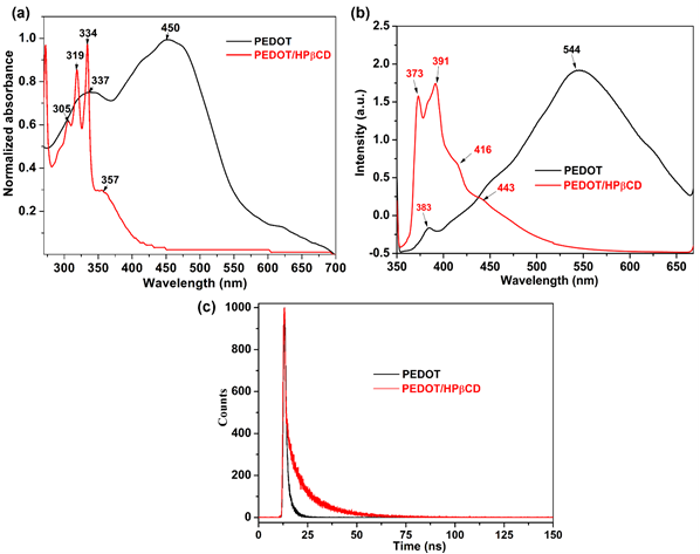
Fig. 8. Absorption spectra of PEDOT/HPβCD polyrotaxane and PEDOT (a), fluorescence (b), and lifetime spectra (c) in ACN.
|
|